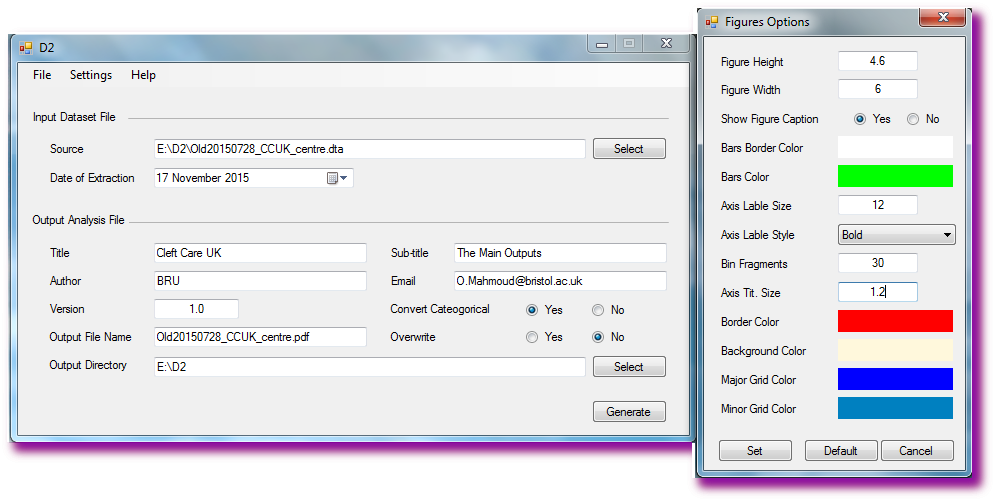
D2 is a novel tool that can use datasets from a wide variety of statistical software packages, such as Stata, SPSS, R, SAS and Excel, and generate a Pdf output (and/or web-based data manual) which includes descriptive information of the variables in the dataset. These information include variable names, labels, data type and descriptive statistics as well as graphical representations. D2 is intended to aid in data monitoring, communication with potential collaborators and archiving of study data.
Why D2?
- An easy and automatic tool to make your data readable and understandable by others.
- It can generate a standard data documentation to:
- show variable types (e.g., categorical, continuous).
- report ‘N’ and missing data.
- present descriptive statistics.
- provide simple graphical representations.
An early simple example of a D2 output in a `pdf’ format using a simple data set can be viewed from here.
Benefits for Yourself and Your Collaborators:
* Capture (snapshot) a data manual.
* Monitor your data.
* Share the current status of a study.
* Basic descriptive statistics & graphical presentations.
* Without showing raw data, present a detailed document for a study.
Benefits for Academic Communities:
* Future researchers can understand and interpret the data.
* Enrich data archive repositories.
Benefits for Participants:
* Previous participants can stay connected with the study.
* Gives future participants an insight into what previous studies have been done.
Benefits for Statisticians:
* Guides for cleaning and pre-processing (if needed).
* Extracting, organizing and displaying statistical information.
* Consistent reports for describing studies.
* Summarizing large number of variables in one go.
* Automatically presenting results in a well designed report with a personal flavour.